Kubernetes
Kubectl
Debugging
Debugging kubernetes pods with kubectl

Debugging Kubernetes pods can be a daunting task, especially for those new to the ecosystem. However, with the right tools and techniques, you can efficiently identify and resolve issues. In this blog, we will explore various methods to debug Kubernetes pods using kubectl, the command-line tool for interacting with Kubernetes clusters.
Understanding the Basics
Before diving into debugging, it's essential to understand the basic components of a Kubernetes pod. A pod is the smallest deployable unit in Kubernetes, which can contain one or more containers. When a pod fails or behaves unexpectedly, it can be due to various reasons, such as application errors, misconfigurations, or resource constraints.
Prerequisites
Ensure you have the following before proceeding:
- A running Kubernetes cluster.
kubectlinstalled and configured to communicate with your cluster.- Sufficient permissions to access the resources in the cluster.
Step 1: Check Pod Status
The first step in debugging is to check the status of the pod. You can do this using the following command:
kubectl get pods
This command will list all the pods in the current namespace along with their statuses. Look for the STATUS column, which can show values like Running, Pending, CrashLoopBackOff, or Error.
Example Output
NAME           READY   STATUS             RESTARTS   AGE
my-app-1234    1/1     Running            0          5m
my-app-5678    0/1     CrashLoopBackOff   3          10m
In this example, my-app-5678 is in a CrashLoopBackOff state, indicating that it is failing to start properly.
Step 2: Describe the Pod
To get more detailed information about a specific pod, use the describe command:
kubectl describe pod <pod-name>
This command provides detailed information, including events, container statuses, and resource limits.
Example Command
kubectl describe pod my-app-5678
Example Output
Name:           my-app-5678
Namespace:      default
Priority:       0
Node:           node-1/192.168.1.1
Start Time:     Mon, 01 Jan 2023 10:00:00 +0000
Labels:         app=my-app
Annotations:    <none>
Status:         Running
IP:             10.244.0.5
Containers:
  my-app:
    Container ID:   docker://abcdef123456
    Image:          my-app-image:latest
    Image ID:       docker-pullable://my-app-image@sha256:abcdef...
    Port:           8080/TCP
    Host Port:      0/TCP
    State:          Waiting
      Reason:       CrashLoopBackOff
    Last State:     Terminated
      Reason:       Error
      Exit Code:    1
    Ready:          False
    Restart Count:  3
    Environment:    <none>
    Mounts:         <none>
Events:
  Type     Reason     Age                From               Message
  ----     ------     ----               ----               -------
  Normal   Scheduled  10m                default-scheduler  Successfully assigned default/my-app-5678 to node-1
  Normal   Pulling    10m                kubelet            Pulling image "my-app-image:latest"
  Normal   Pulled     10m                kubelet            Successfully pulled image "my-app-image:latest"
  Warning  BackOff    9m (x4 over 10m)   kubelet            Back-off restarting failed container
In the output, pay attention to the State and Last State sections. The Reason field can provide insights into why the container is failing.
Step 3: Check Logs
If the pod is crashing, the next step is to check the logs of the container. Use the following command:
kubectl logs <pod-name>
If your pod has multiple containers, specify the container name as well:
kubectl logs <pod-name> -c <container-name>
Example Command
kubectl logs my-app-5678
Example Output
Error: Cannot find configuration file
This log message indicates that the application is unable to find a required configuration file, which could be a misconfiguration in your deployment.
Step 4: Execute a Command in the Pod
If the logs do not provide enough information, you can execute a command inside the pod to troubleshoot further. Use the exec command:
kubectl exec -it <pod-name> -- /bin/sh
This command opens a shell inside the container, allowing you to inspect the filesystem, check environment variables, or run diagnostic commands.
Example Command
kubectl exec -it my-app-5678 -- /bin/sh
Example Commands Inside the Pod
Once inside the pod, you can run commands like:
- Check the current directory
pwd
- List files
ls -la
- Check environment variables
env
Step 5: Check Resource Usage
Sometimes, pods fail due to resource constraints. You can check the resource usage of your pods using the following command:
kubectl top pod <pod-name>
Example Command
kubectl top pod my-app-5678
Example Output
NAME           CPU(cores)   MEMORY(bytes)
my-app-5678    200m         512Mi
If the pod is using too much CPU or memory, consider adjusting the resource requests and limits in your deployment configuration.
Step 6: Review Events
Kubernetes events can provide additional context about what is happening in your cluster. You can view events for a specific namespace using:
kubectl get events --namespace=<namespace>
Example Command
kubectl get events --namespace=default
Example Output
LAST SEEN   TYPE      REASON              OBJECT                  MESSAGE
10m         Normal    Scheduled           pod/my-app-5678        Successfully assigned default/my-app-5678 to node-1
9m          Warning   BackOff             pod/my-app-5678        Back-off restarting failed container
How can Gravity Cloud help?
Gravity provides a comprehensive platform for managing and optimizing your Kubernetes clusters. With Gravity, you can:
- Monitor resource usage and identify potential bottlenecks.
- Optimize resource allocation to improve pod stability.
- Automatically scale your pods based on resource usage.
- Provide detailed insights into pod behavior and potential issues.
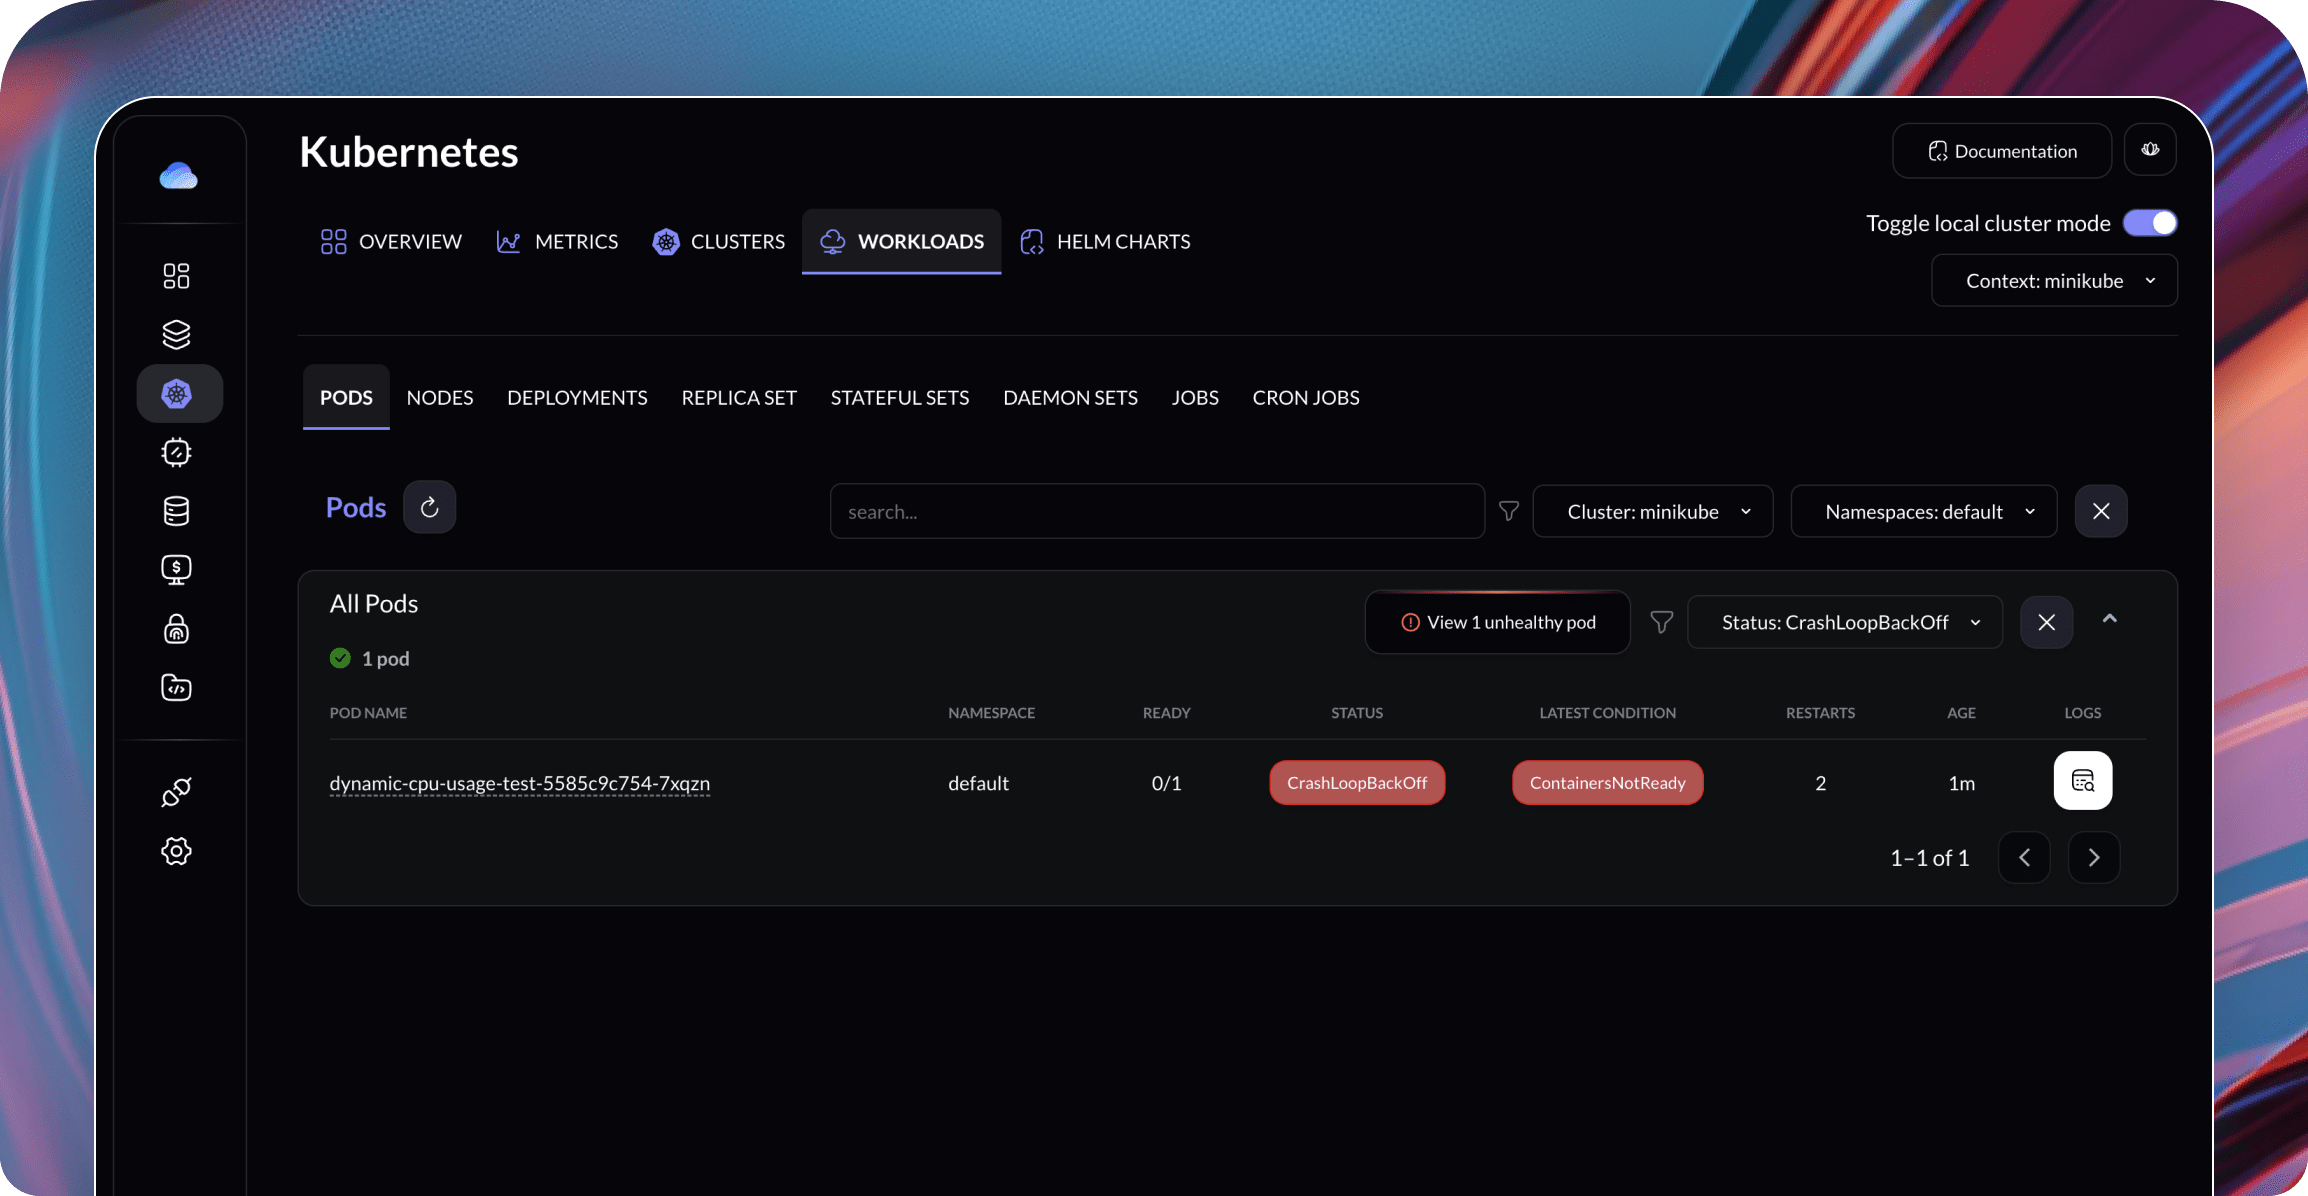
Let's install the Gravity Cloud app to debug the pods in your cluster: (Download the app from here)
List the pods in your cluster
- Navigate the
Kubernetes→Workloadssection - Pods in bad state are automatically highlighted
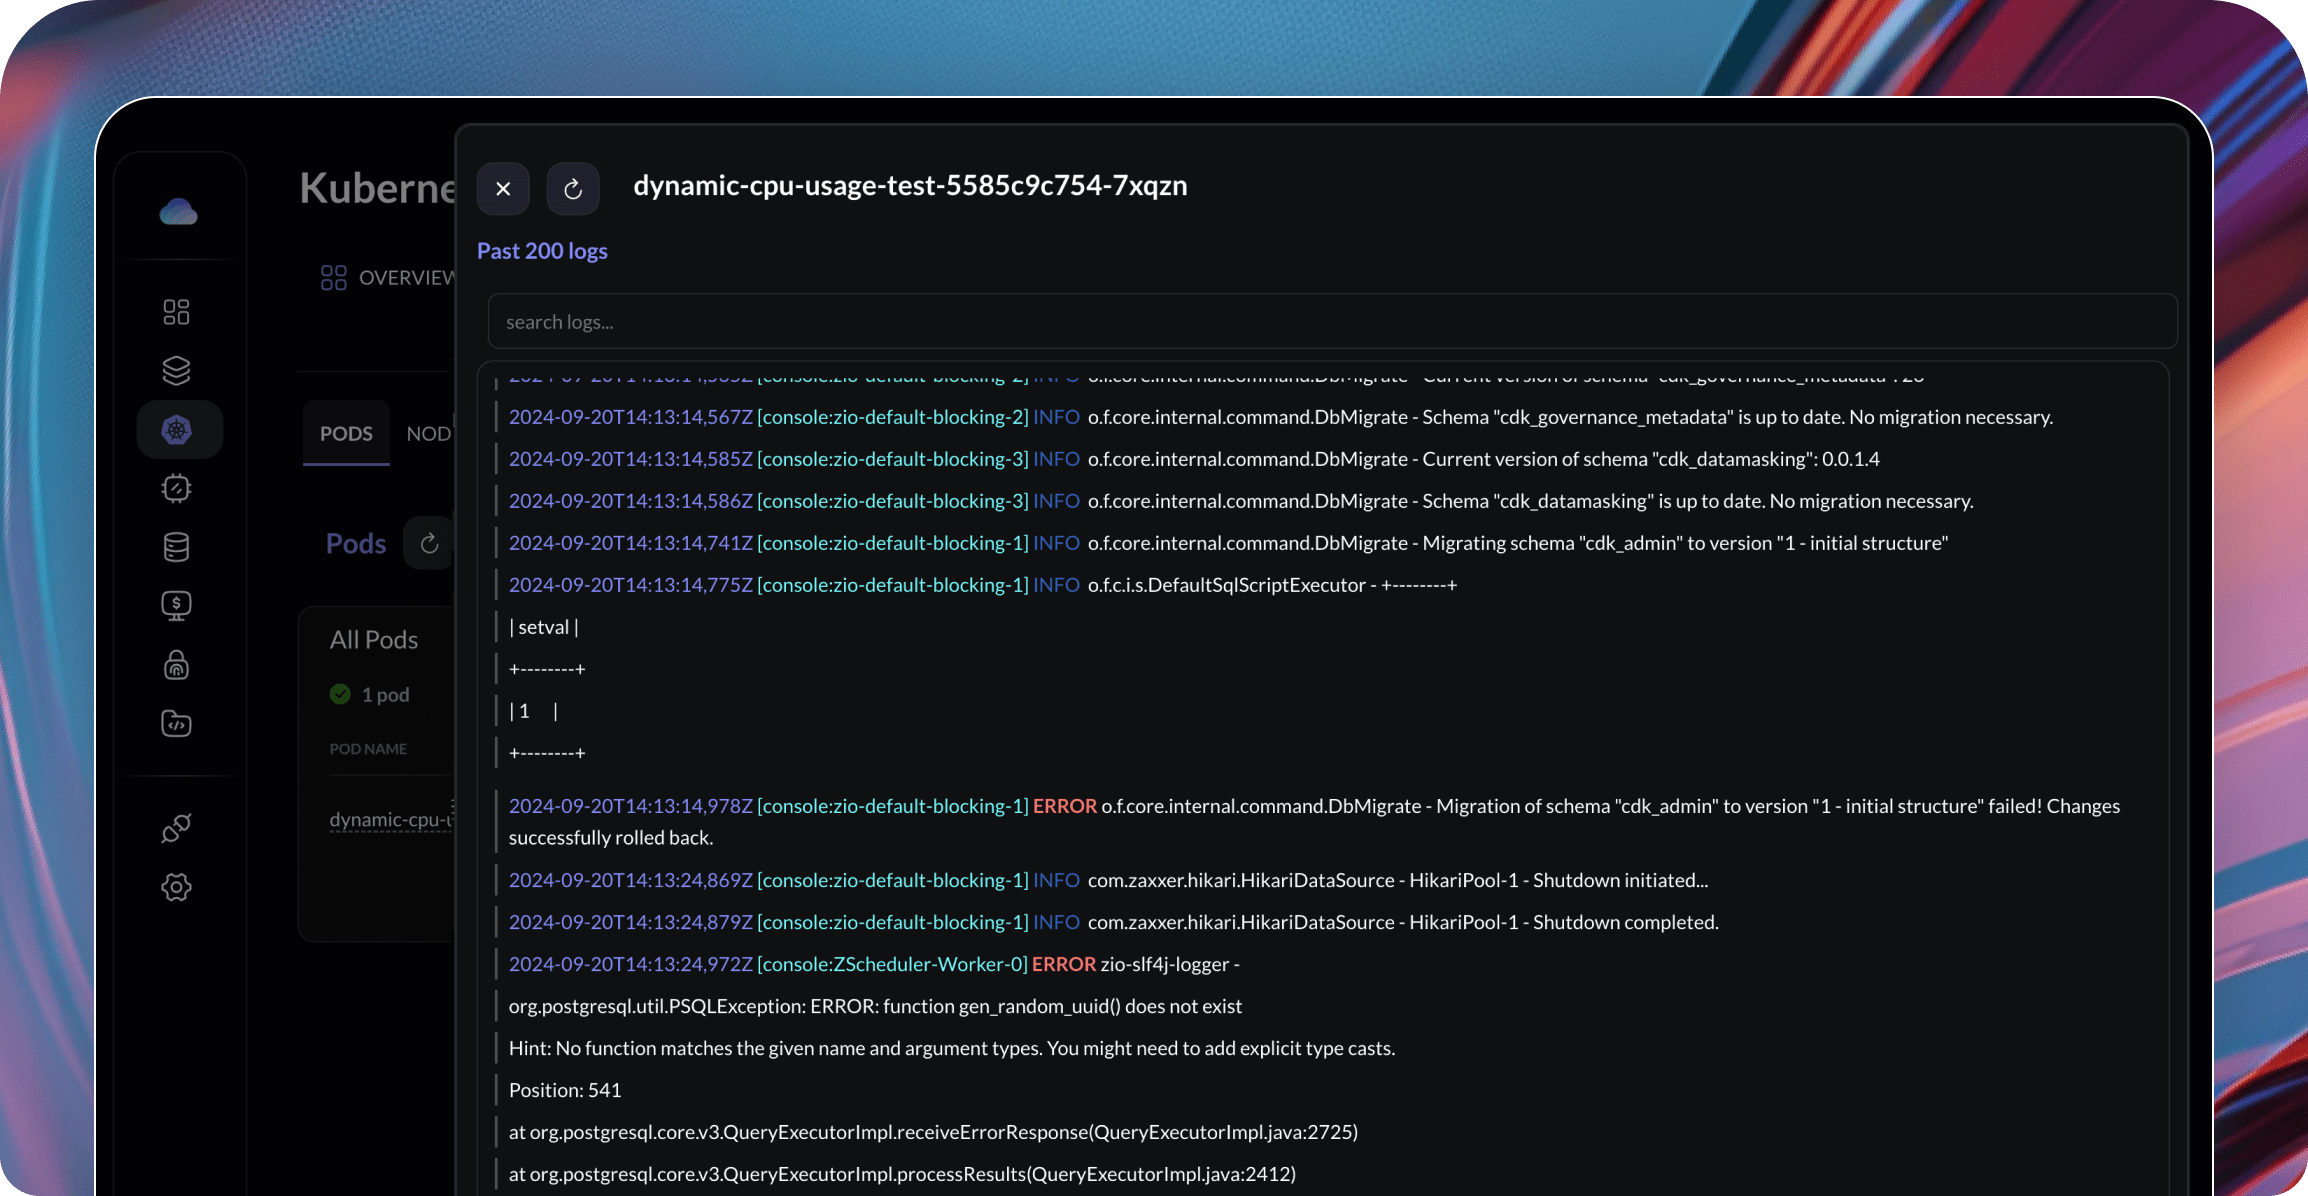
Check the logs of a pod
- Click on the logs icon on the right column in the pods table
- You can seach the logs with
Full-text searchcapability and see LOG levels and timestamps
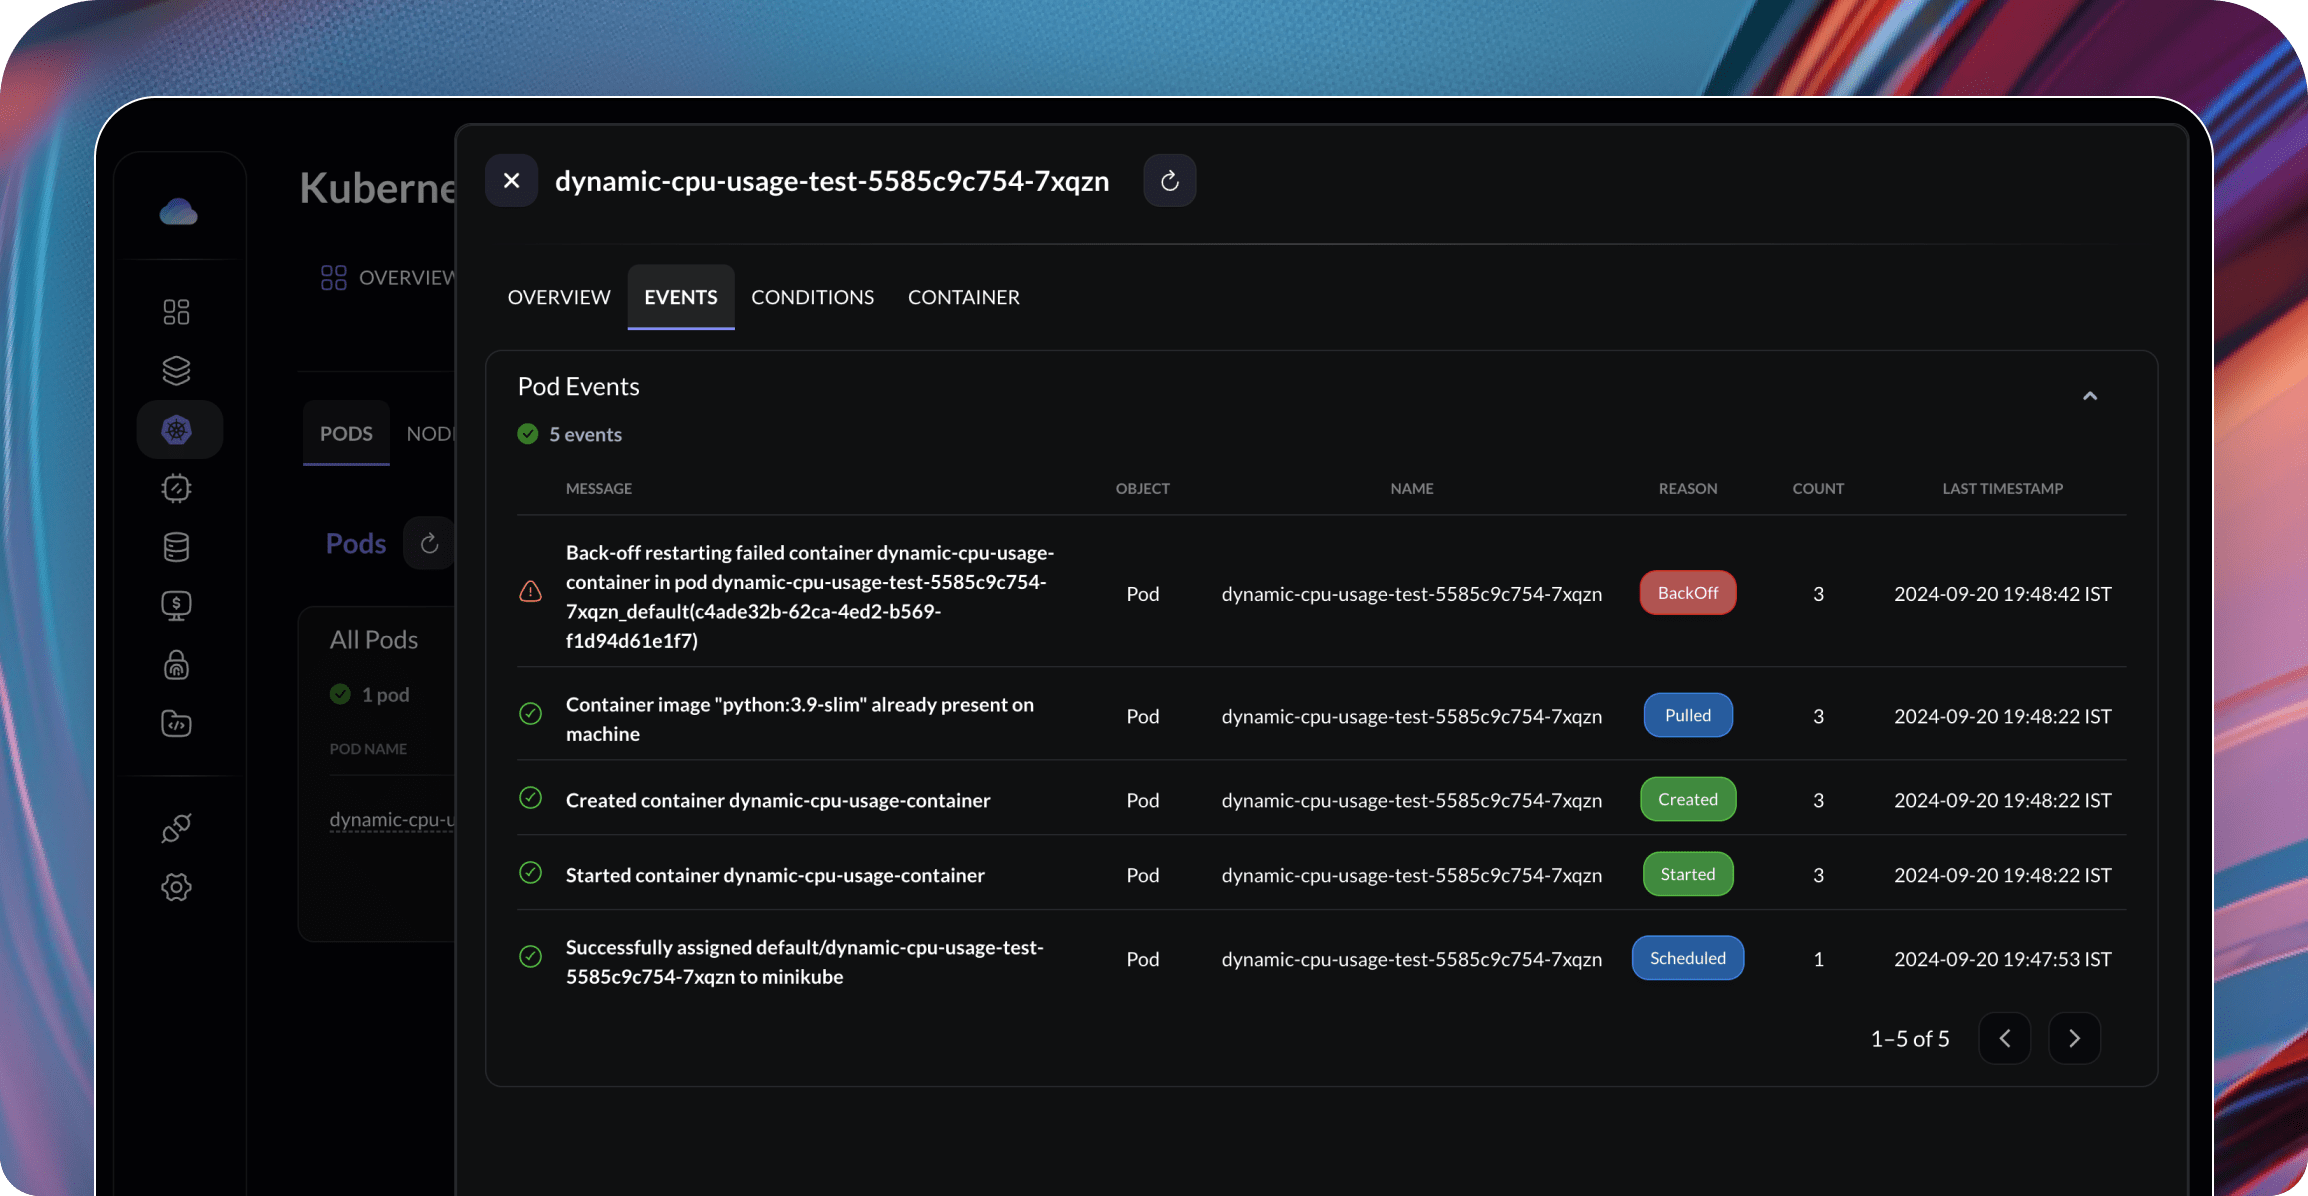
Check the events in the pod
- Click on the
pod-namein the table and click onEventstab
Using Gravity Cloud, debugging becomes easier and faster, without having to run
kubectlcommands everytime.
I hope this blog post provides valuable insights into DevOps, Kubernetes and cost-saving benefits. If you have any questions or need further assistance, feel free to ask!
If you like this, follow us on Twitter and LinkedIn and explore our platform to help save you more cloud costs - gravitycloud.ai
Share this Article: